


White Paper: Bringing Greater Predictability and Control to Management
Management at every level is informed by the ability to predict and control the productivity and output of their zones of responsibility.
Managers often take action based on a lack of information. They are drawn in to the activities of the areas over which they are responsible. They have no fundamental protocols on which to base their actions, and the resulting effects of their interventions can be unintentionally intrusive and unpredictable.
This creates risk and overworked executives, and staff who lose their initiative.
Recent discoveries have revealed solutions to this that bring about a more productive, predictable, controllable and efficient environment with less risk and higher morale.
“If you want to go fast, go alone. If you want to go far, go together.” African proverb
The verb “to manage” means “to have control over,” and is interpreted by many to mean that one must directly supervise and control the activities of the people being managed. This common misconception is incorrect and destructive as it undermines various fundamentals upon which expansion depends.
A manager, after all, should not be concerned with the activities of the people he manages, but with the co-ordination of the results they are getting and the liaison with external areas with which these results are exchanged.
PRE-REQUISITES FOR PRODUCTIVITY
Most production problems boil down to only two factors:
1. Poor Hiring Protocols. This is obvious, as one cannot build anything with broken straws. Bad hires are very expensive in the attention and energy they absorb from management and fellow teammates. Therefore hiring protocols must be sound and produce good personnel that can be trained.
2. Not Training People on their Jobs. Every job produces a result that is exchanged with the organization. The job includes the activities required to produce this result. Not training people correctly on these things produces failed staff members and managers who must then continually intervene.
STATISTICS
Production Statistics measure what is produced, and are therefore the tools with which a manager manages. They improve the ability of managers to see what is going on now and, further, allow some prediction of what will happen in the future.
The subject of statistics is taught in every business school, but what we are never taught is that a statistic represents a trend of behavior, and that each of these trends has its own very precise package of steps – a formula – that resolves that trend to a higher trend.
Production statistics are not to be confused with, for example, stock market statistics which are attempts to monitor the whims of the marketplace and do not measure productivity. Similarly, the stats kept by insurance companies are actuarial tables used to calculate insurance risks and premiums, and have little to do with managing productivity. These uses of statistics are, in effect, for monitoring risk.
There is no risk in the statistics used to monitor productivity. Rather, there is prediction and control. Production statistics eliminate risk as they remove the mystery from management.
Statistics, as we apply the term in this White Paper, reflect the activity and effectiveness of people on their jobs.
TRENDS
There are six possible trends:
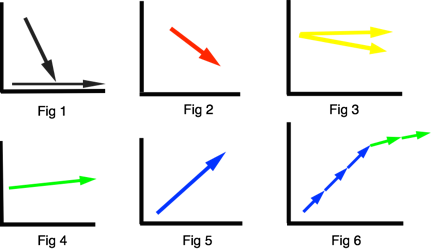
Each of these trends demonstrates a unique state of operation. It does not matter whether the thing being measured is the number of candy bars produced, the viability of the group or the operational square feet of the facility.
These operating states, referred to as conditions, were not invented. They are the expressions of Natural Law and are easily observed. What has not been noticed until recently is the fact that these conditions flow one in to the next in the same way a flower grows from seed to a fully mature plant.
Conditions in an organization are revealed at a glance by correctly scaled statistics. The operating condition reflected in the trend of the graph reveals a very precise anatomy that must be resolved in order to improve the operating condition to a higher condition.
Statistics Show the Pulse of the Organization
Every position and job in a company produces a result that can be monitored by a statistic. When stats are absent, the door is open to all manner of risks and wasteful investment of resources. Without correctly scaled statistics, one cannot precisely assess the operating condition of a job or area. One must revert, then, to instinct – a difficult thing to teach and unreliable at best. Management thus becomes a fickle intervention rather than a stable, guiding influence.
The formulas connected with each of these conditions provide prediction and regulation. Because they are consistent in their application, they provide a common thread through every echelon and job in a group. They allow anyone greater control and predictability of his or her job, and better co-ordination between the various echelons and sections of a group.
Expansion and Contraction
Natural Law tells us that things either expand or they contract. The natural principals of this woof-and-warp are monitored by these conditions. Thus, they are universally applicable to anything from a marriage to a multi-national business or a government.
Fig 1 above is a condition called “The New Job” condition and exists when no one is controlling the area. It’s a plunging line, or one that bounces along the bottom of the graph.
This occurs, for example, when someone goes on holiday without a replacement. Productivity in this area drops in to non-existence. It also occurs in areas where something has dramatically changed and the person in charge of the area has not accommodated for it and has completely disconnected from the area. It also occurs when a person first takes over a new position or an entrepreneur begins a new enterprise.
Whatever is the situation that brought about the condition, there are 4 points in its anatomy that are resolved by the corresponding formula for repairing it, called the “Non-Existence” formula.
Figure 2 shows a dangerous condition and intervention will be required to get this area turned around. It is the condition that occurs, for example, in a fire line when people are passing buckets one to the next in order to put out the fire. One person on this line is fumbling the buckets and losing the water. This puts the entire activity in a dangerous condition as the water stops coming and the fire grows. This person must be bypassed and his job done by the fire brigade manager until the fumbler can be brought back up to speed and put back on the line again.
It is also the condition that exists after one has applied the Non Existence formula and starts going up the conditions. He does not yet have control of the job or area and some assistance is indicated to get him fully engaged with it.
Danger conditions are also brought about by intrusive management orders that do not consult the condition of an area. Arbitrary orders introduced to an area that is doing well actually erodes that stability. Some managers “bypass” as a standard operating procedure. This is quite destructive no matter the intent of the manager.
Also, it is a law that when new order is introduced to an area, disorder will appear for a short while every time. The trick is to ignore this disorder, and stay focused on the order being accomplished. The Non-Existence formula is introducing order, and the blowback that ensues is resolved by the application of the five points of the Danger formula.
It is for want of correctly applied Danger formulas that most businesses fail in their first year. Its personnel focus on the disorder, and do not create enough order to generate the viability to survive. These groups never get through the Danger condition, but, rather, fall back in to Non Existence.
Once the Danger formula steps are implemented, the condition improves to an Emergency condition (Fig 3). This line reveals a condition whereby the productivity in this area remains at a certain level, or is slightly eroding (down-trending). The business that is “staying the same” is actually in a condition of Emergency. The costs and challenges of operation are increasing. Therefore, staying at the same level of production is, in reality, an emergency vis-à-vis the survival of the activity.
This condition reflects an anatomy that must be resolved in order to turn the flat or slightly down-trending productivity to an upward trend. The anatomy of an Emergency trend contains 5 elements. The formula that resolves the condition therefore has five steps. Once they are implemented the condition is resolved and an enhanced state of operation is the invariable result.
Then we have a Normal operating condition (Fig 4). Applying the four steps of that formula we bring about an Affluence condition (Fig 5). The four steps of that formula, continuing, bring a continuing Affluence until it finally peaks in a whole new range of productivity.
At that point the statistic rolls in to a gentle increase (“Normal”) in a whole new and productive range (Fig 6). This is a very stable condition called Power. Applying the steps of the Power formula one strengthens the power, and also makes this job ready to be taken over by another person, freeing the one who got the area in to Power to be promoted or re-assigned to another area. One can alternatively remain in a condition of Power on a job and, by monitoring the formulas, improve on this power.
The person replacing the Power person applies the formula of Power Change to that job or area.
It is almost an axiom in businesses today that the “new broom sweeps clean.” This is to say that the person taking over comes in and changes everything. This might be appropriate for someone coming in to an area that has crashed in to Non-Existence – in which case that person taking the job would apply the Non-Existence formula – but it is definitely an ERROR to do this in an area that is in the condition of Power. The Power Change formula ensures that this “passing of the baton” occurs smoothly and effortlessly and without any loss in productivity.
These conditions from Non-Existence to Power and Power Change flow seamlessly one in to the other. All one needs to do is to apply the next step. The skill in managing a job or an area is in the correct identification of the condition being addressed, and the ability to translate the formula in to action on the ground.
SCALING STATISTICS
When statistics are improperly scaled one cannot identify the conditions they represent. This opens the area to an incorrect assignment of condition.
Here is an example:
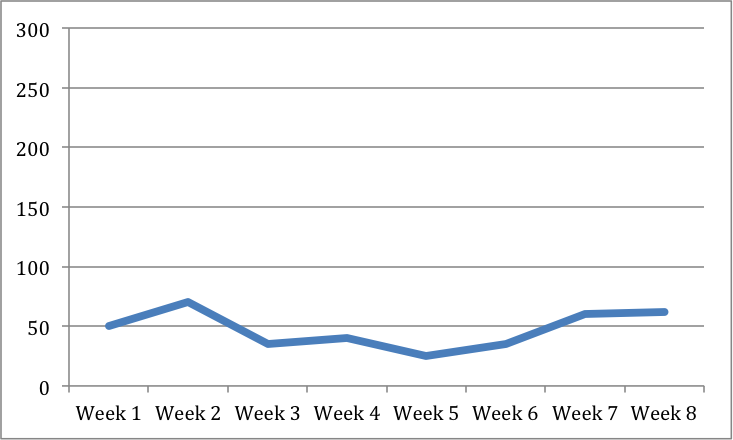
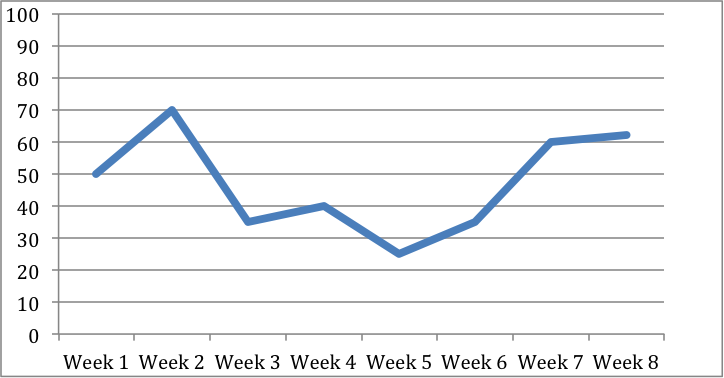
Sold Candy Bars (SCB) incorrectly scaled

Sold Candy Bars (SBC) correctly scaled
These graphs demonstrate not only the visual distinctions between these trends, but show how a correctly scaled graph allows an assignment of the condition it reveals.
Reading statistics requires knowing how to scale them correctly, interpret them and then assign the correct condition and its formula.
The condition exists whether one uses statistics or not. Statistics, correctly scaled, simply make it easy to identify these conditions.
The Wrong Formula Brings Down Productivity
It is an interesting and important fact that when one applies any other formula to a job or area than the formula for the condition the area is actually in, the actual condition erodes to the next lower condition.
In other words, if an area is in a Normal condition – slightly up-trending – and the manager of that area applies any other formula than the Normal formula, the condition of the area erodes to Emergency. If that manager continues to apply the incorrect formula, the area erodes further in to Danger and then Non-Existence. This leaves the manager wearing all of the hats of that area, with his staff standing around waiting for orders.
This fact speaks to the critical importance of understanding the true value of managing by statistics and conditions. It is not a matter of opinion. It is Natural Law. When you apply this material correctly, Mother Nature is on your side. When you don’t, extinction looms.
Extinction is simply Mother Nature’s way of saying, “You broke the rules.”
Thus, statistics play a critical role in management, as without them we are operating blindly.
Statistics Represent What is Actually Going On
Statistics represent what is actually going on and must reflect a realistic picture in order to be useful.
For example, in a seasonal business where peek periods are commonplace, as with a florist for example, we can find the graph is thrown off to accommodate these periods, rendering the correct reading of the graph impossible.
The following graph shows a week of huge activity to demonstrate the effect that Mother’s Day might have on the Florist’s ability to manage the shop by statistics:
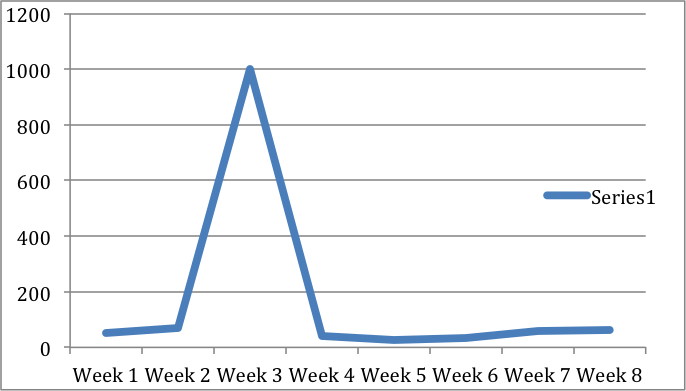
Flowers Sold and Delivered (FSD)
Week two shows the productivity on Mother’s Day for this florist. To accommodate this unusual production the entire graph is skewed, and useless for management purposes.
In seasonal businesses where spikes are predictable, these periods should be plotted on their own separate graphs so as not to distort the day-to-day, week-to-week operations. This, then, allows us to compare “apples with apples” instead of confusing the picture by combining operating conditions that change with the season on the same graph.
For this florist, for example, there would be a “Seasonal Stat” that allows us to compare Mother’s Day periods with Mother’s day periods, and not “mixing the barrel” to include the day-to day traffic. This allows us to accommodate for unusual periods without distracting normal operations, and still retain good prediction and control through the application of correctly assigned conditions.
Not doing this we would see an “Affluence” spike (week 2) that cannot realistically be applied as the ingredients for the Affluence cannot be continued in the day-to-day operations. They can, however, be applied the next time Mother’s Day rolls around.
IMPORTANT NOTES
Because managing by statistics is poorly understood in the business community it is common to find companies managing by yearly-trending statistics. This is folly because one cannot control an annual trend. Statistics are used to manage productivity in the present and future. The “present” that involves more than a 3 to six week span of time is simply out of touch with what is happening now. The executive is no longer managing, but guessing.
For example, some years ago we were called in to a division of a large electronics corporation to help them turn around a 7-year fall of statistics from a market share of 92% to 78%. We affected that turnaround and, over the next 6 months, the division was producing more than it had in the prior three years, well on it’s way to restoring its earlier position in the market. However, the senior management of this company, based in another country, had – many months earlier – decided to make a personnel change in this division which was robotically enforced without regard for the changed condition of the area. Ignoring the current Affluence condition, the change ordered from senior management collapsed the division to its earlier 7-year trend.
Needless to say, senior management for this company did not manage by statistic as it is described herein, and this absent knowledge cost them dearly.
The point here is simple: the trends of statistics, in order to regulate productivity and enhance prediction and control, need to be monitored on a timely basis. After all, the condition of Emergency will erode quickly to Danger when the formula is not applied.
What “timely” means depends on the distance from the production area. As one moves up the echelons of management he or she becomes interested in wider swaths of time. One who writes letters monitors his stat on an hourly or daily basis. The Mail Manager monitors the area on a weekly basis. The Promotion Manager who is several levels above the letter writer would monitor on weekly or three-weekly trends. The Marketing Manager might monitor by three to six-week trends, and be unconcerned with the trends at lower levels. In an International Group, its senior management monitors trends by six-week increments to as much as three months, depending on the size of the operation.
Monitoring by inappropriate and very lengthy periods removes control from the equation and renders management ineffective and unresponsive to current trends. A business can disappear in a year. Trends need to be identified quickly and remedied before they erode to lower trends.
It is similarly true that if an echelon of management is concerning itself with the time periods better suited to lower echelons, they become “butt-insky” management and intrude on those echelons below them – bringing about Danger Conditions.
Different echelons of management deal with different spans of time.
Formulas are Applied to One’s Own Actions
Another important observation is that each level applies the formula for the condition of his or area according to this time-table. For example, a GM applying the formula of Emergency to his position as the GM is doing these steps himself for his own area of control. He does not dictate the formulas for lower echelons as each has it’s own condition.
The Mail Manager applies the formula reflected by the stat of the area to his own actions for the coming period and does not apply to the individuals in his area who each has his own statistic and condition. Each applies his own condition formula to his job.
Many hands make for little work.
These conditions formulas and managing by statistics level the playing field throughout the company and get everyone playing by the same rules of engagement. They harness the actions of the group to Natural law, and allow the group to move up the conditions together towards Power, each applying his own formula according to his own area. The stats reveal where the issues are, and the condition formulas supply their solutions.
By way of illustration, the graph below is viewed differently according to the level of management involved.
Mail Out
One-Week Trend (week 7) = NORMAL and would be the condition applied by the Mail Manager.
Three-Week Trend (Week 5, 6 and 7) is an AFFLUENCE trend and would be applied by the Promotion Department Manager to his own actions as regards that area.
Six-Week Trend (week 2 thru week 7) is in NORMAL and would monitor the activity of the Marketing Executive as regards his own evaluations of the Promotion Department and his coordination of its production with other departments under his flag.
SUMMARY
Managing by Statistics and Formulas is a wonderful boon to management as it allows prediction, regulation and control to the production of every area and job in the company, and removes many risks associated with simply allowing staff to “figure things out as they go along.”
This system needs to be applied across the boards in our business community, as the hope of our civilization is born on the backs of productive people who have the tools they need to control their destinies.
Managers are free to do their own jobs and not be buried in the activities of their juniors. Juniors are liberated from “butt-insky management” and free to enjoy the morale that attends productivity. There are no “favorites” on staff, nor is there the phenomenon occurring whereby some personnel are carried on the shoulders of the productivity of others. This system allows justice. (Injustice is the source of riots and disaffection.)
Each person has a right to his or her own job, and to be responsible for it. Each has an “Owner’s Manual” that enables him or her to take control of that job or area and make a real contribution to the team and to the final benefactor of this improved efficiency: our customers.
Prosperity, profitability and high morale are not only possible, but assured.
Respectfully tendered for your consideration.
Mark Shreffler, Director
Rainmakers Common Sense Workshops®